In the stock market paradigm, profitability is the gold standard against which enterprises are measured. Without profits, companies find it difficult to thrive and grow. Some investors think that the biggest companies make the biggest profits. But, that is not always true.
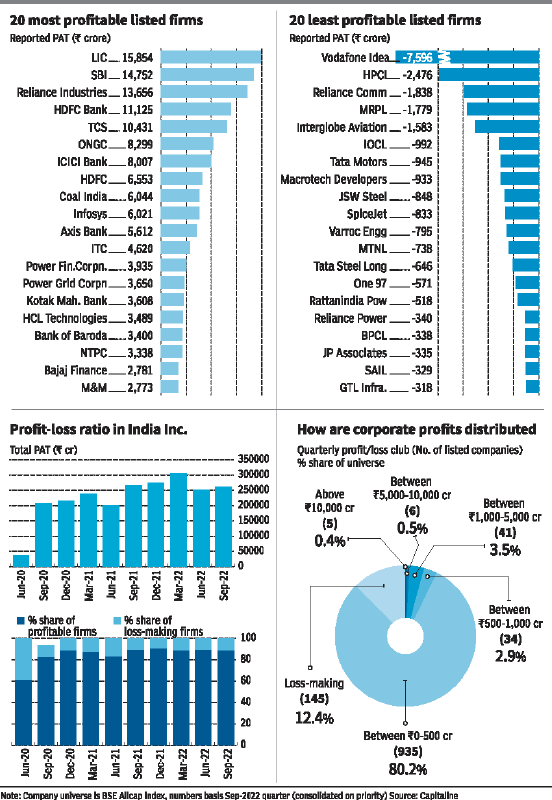
Here are five infographics that will give you a fresh perspective on the profit picture of India Inc.
The 20 most profitable listed companies are led by LIC, SBI, Reliance Industries, HDFC Bank and TCS. They have cumulatively made over ₹ 1.37 lakh crore in the July-September quarter of 2022. Interestingly, these companies alone account for more than 50 per cent of the total profit clocked by over 1,100 firms.
Profits are as much a reality as losses. Here are the details about the companies that have made the biggest losses as per September-2022 quarter numbers. The 20 least profitable members of India Inc are led by Vodafone Idea, HPCL, RComm., MRPL and Interglobe Aviation which have cumulatively amassed over ₹ 24,750 crore losses in this quarter.
We looked at the September 2022 quarter earnings of the BSE AllCap index to gauge the profitability of companies. Take a look at the profit-loss ratio. Notice how, barring one quarter i.e. June 2020, over 80 per cent of firms remained consistently profitable over the past two years.
While the Indian market has grown by leaps and bounds, quarterly profits have not reached a huge scale. For instance, there are only three dozen firms that make ₹ 500-1,000 crore profit in three months. Take a look at how profits are distributed in different bands.
Over 80 per cent of companies fall in the ₹ 0-500 crore quarterly profit bracket. There are only handful of firms that posted over ₹ 10,000 crore quarterly profit.
